From breadcrumbs to the toolcase talk: your records are the data

The five-minute version
My slot at IOSP is a short showcase titled Computational Trust. It is about how a person, a community or a machine can tell whether to believe something.
The first attempt was the wrong one
Some years ago, in a research track about rewarding contributors in DAOs, I drew trust as a graph where people are the nodes, with a wallet at the centre and the token balance standing in for credibility. We tested it on real funding data from NEAR. The result I keep coming back to: a token does not remove the gatekeeper, it moves the gate to whoever decides who holds tokens. That is the dark pattern in the first slide.

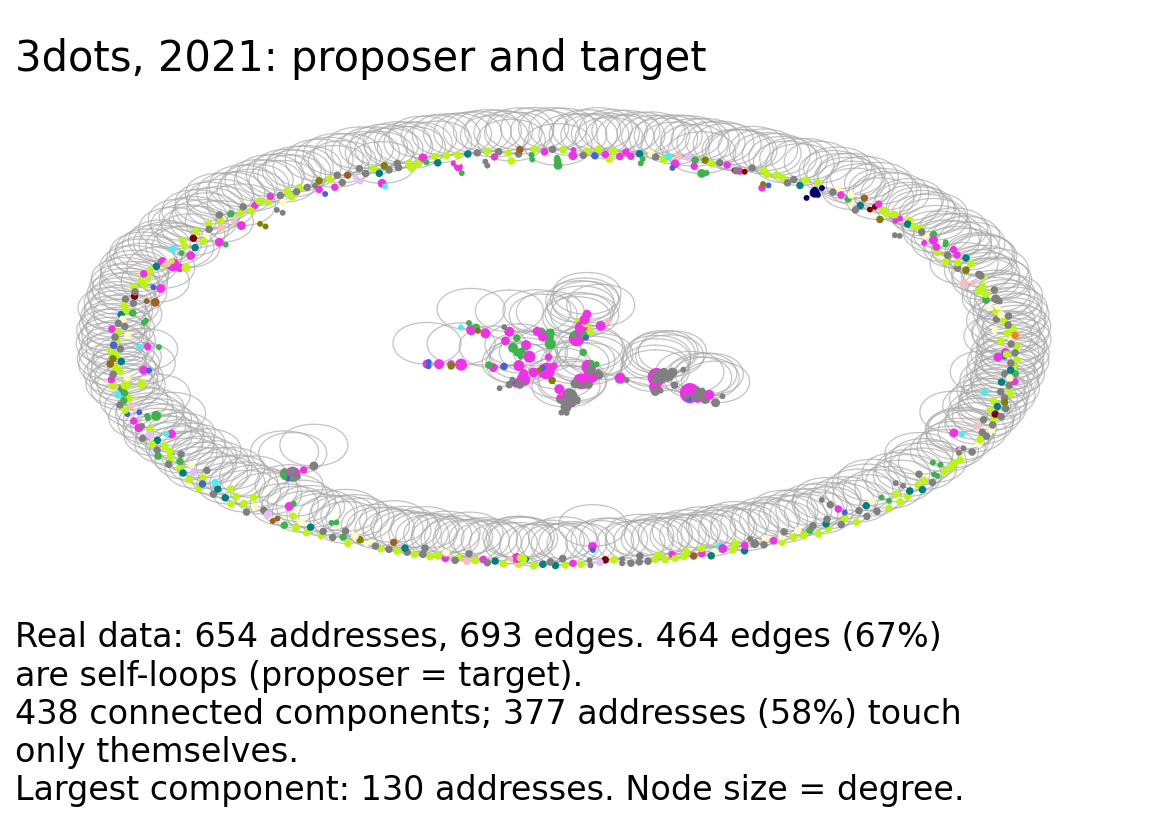
This is the real data: 14 DAOs that shared their records, successful proposals only. Two thirds of the edges are loops, where the address asking and the address receiving are the same. That is not proof anyone funded themselves, but it shows where the gate sits.
Flipping it
Breadcrumbs flips the graph. A node is a claim: a signed record that says something happened and here is the evidence. An edge is a typed connection a person signs, supports, opposes, evidence. Identity becomes the least interesting part, just who signed it, and it lives in their own repository. Badges and affiliations stay as the base layer and claim nodes go on top, so nobody needs permission to add one.

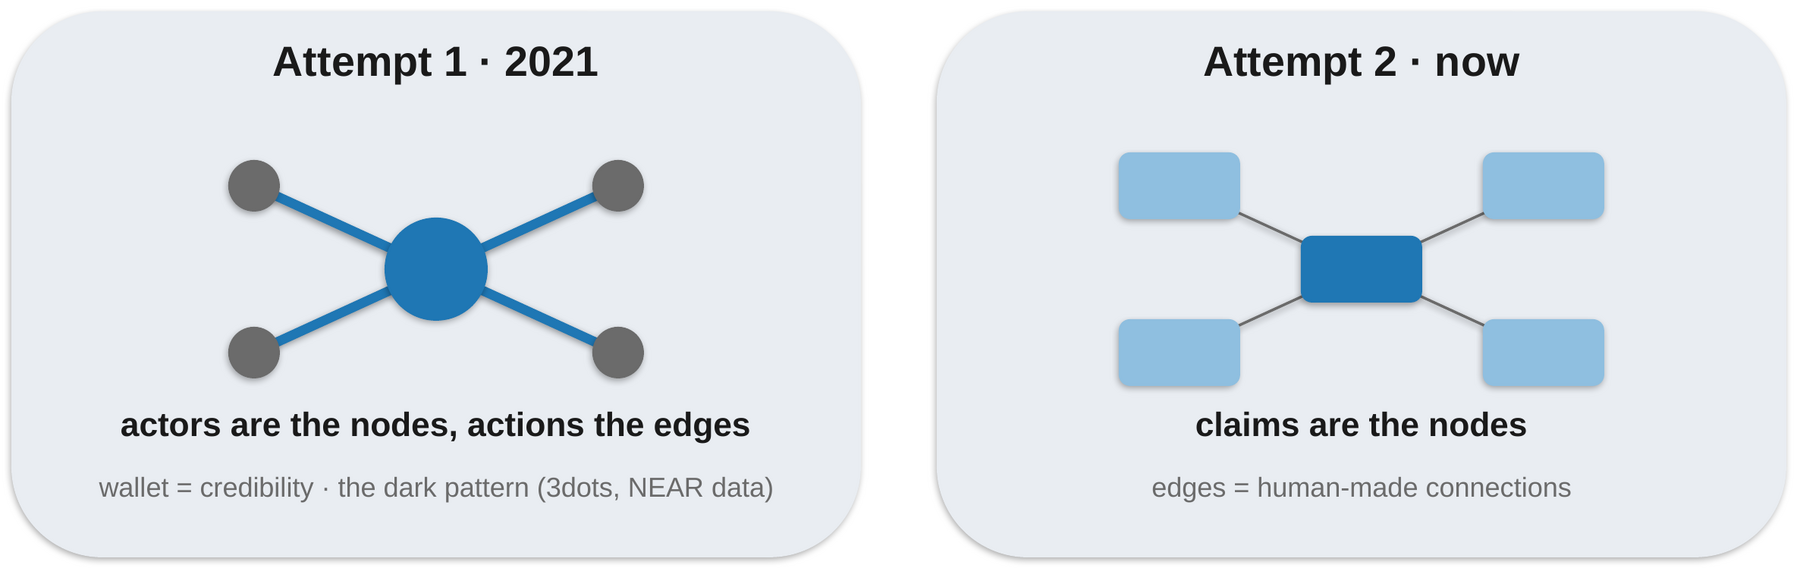
The same question drawn twice, as on my first slide. On the left, people are the nodes and a wallet sits at the centre. On the right, claims are the nodes and the edges are connections that people make.

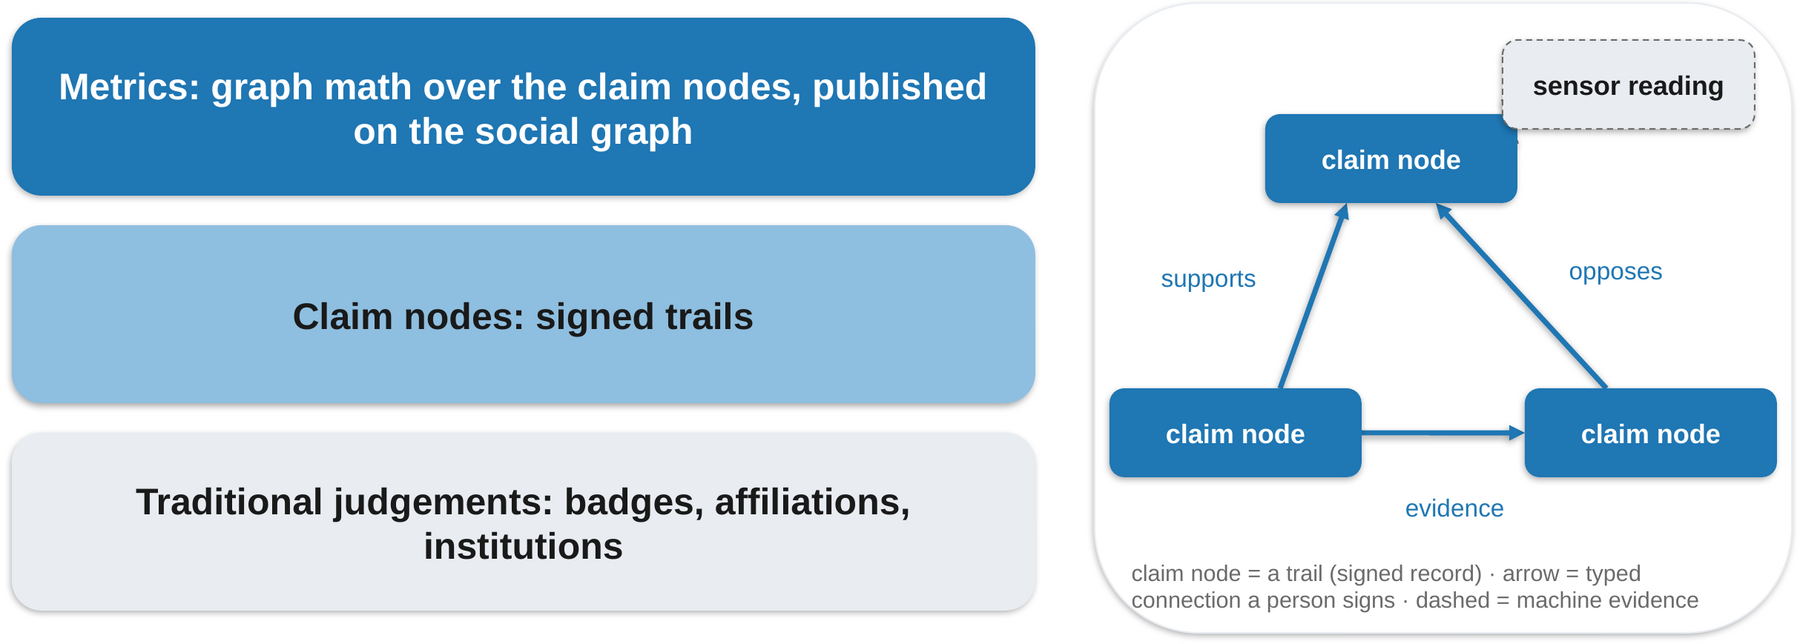
Each box is a signed trail, each arrow a typed connection that a person signs. The dashed box is machine evidence, such as a sensor reading. Badges and affiliations stay underneath, and the metrics sit on top.
Where the physical objects come in
A record alone does not prove you were there. A sensor reading written by a script that ships with a simulator proves nothing about presence. So the station adds locality: you tap an object, and the claim is that you were physically at it. That is why the crumbs are hardware and not a button on a web page. The tap is the only part of the chain a purely digital self-mint can never carry.

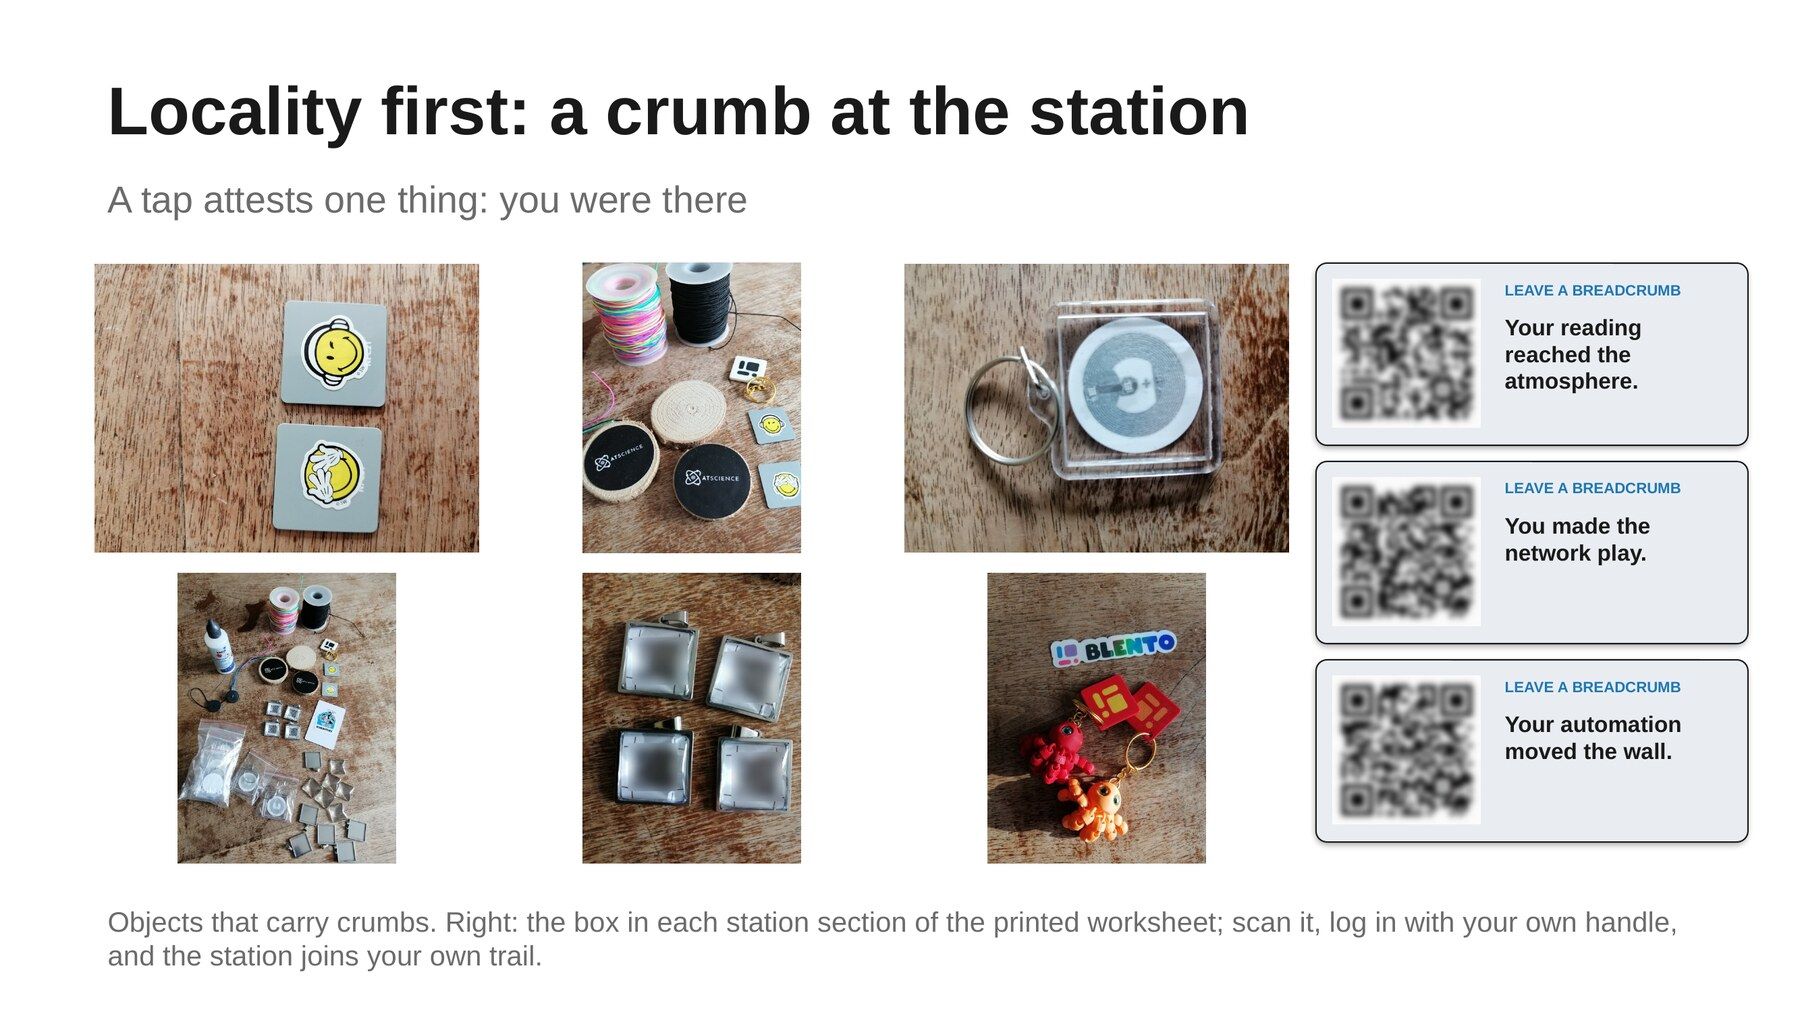
The objects and the worksheet boxes, as on my slide. The codes in the pictures are blurred on purpose: a QR code in a photo is a live anchor, and anyone could tap it from their sofa.
Atmospheric evidence
At the stations you do something real, you stream a sensor reading or play a note, and the signed record travels live over the same public infrastructure as everything else on ATProto. Then you tap or scan, and your trail picks up that station's colour. The records people leave are the first real data for the question I started with: what does a claim graph look like when people actually make it, instead of when I draw it?

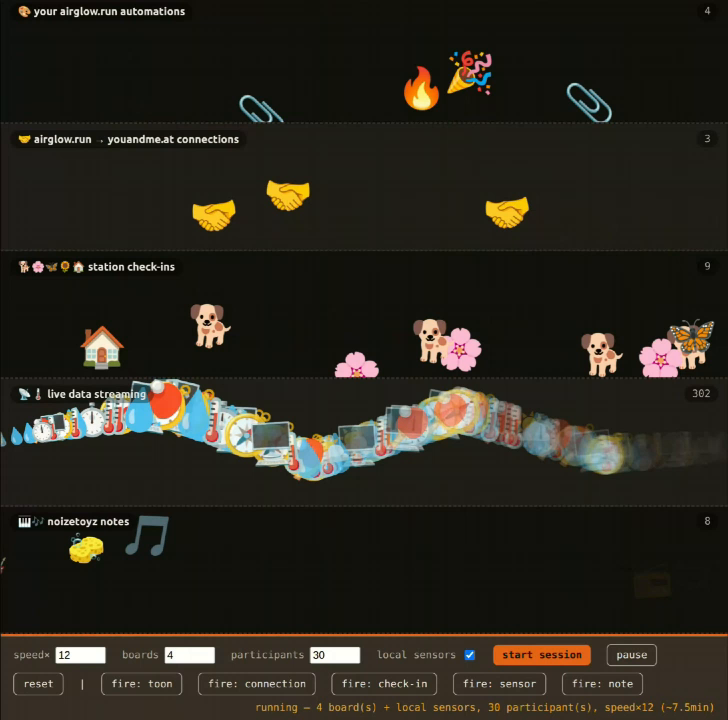
This is the toon board, the wall where everything arrives as one fabric: dogs and blossoms are check-ins, handshakes are connections, thermometers are sensor readings, and notes are synth notes. It is a simulated session, four boards and thirty people at twelve times speed, not a recording of a real one.

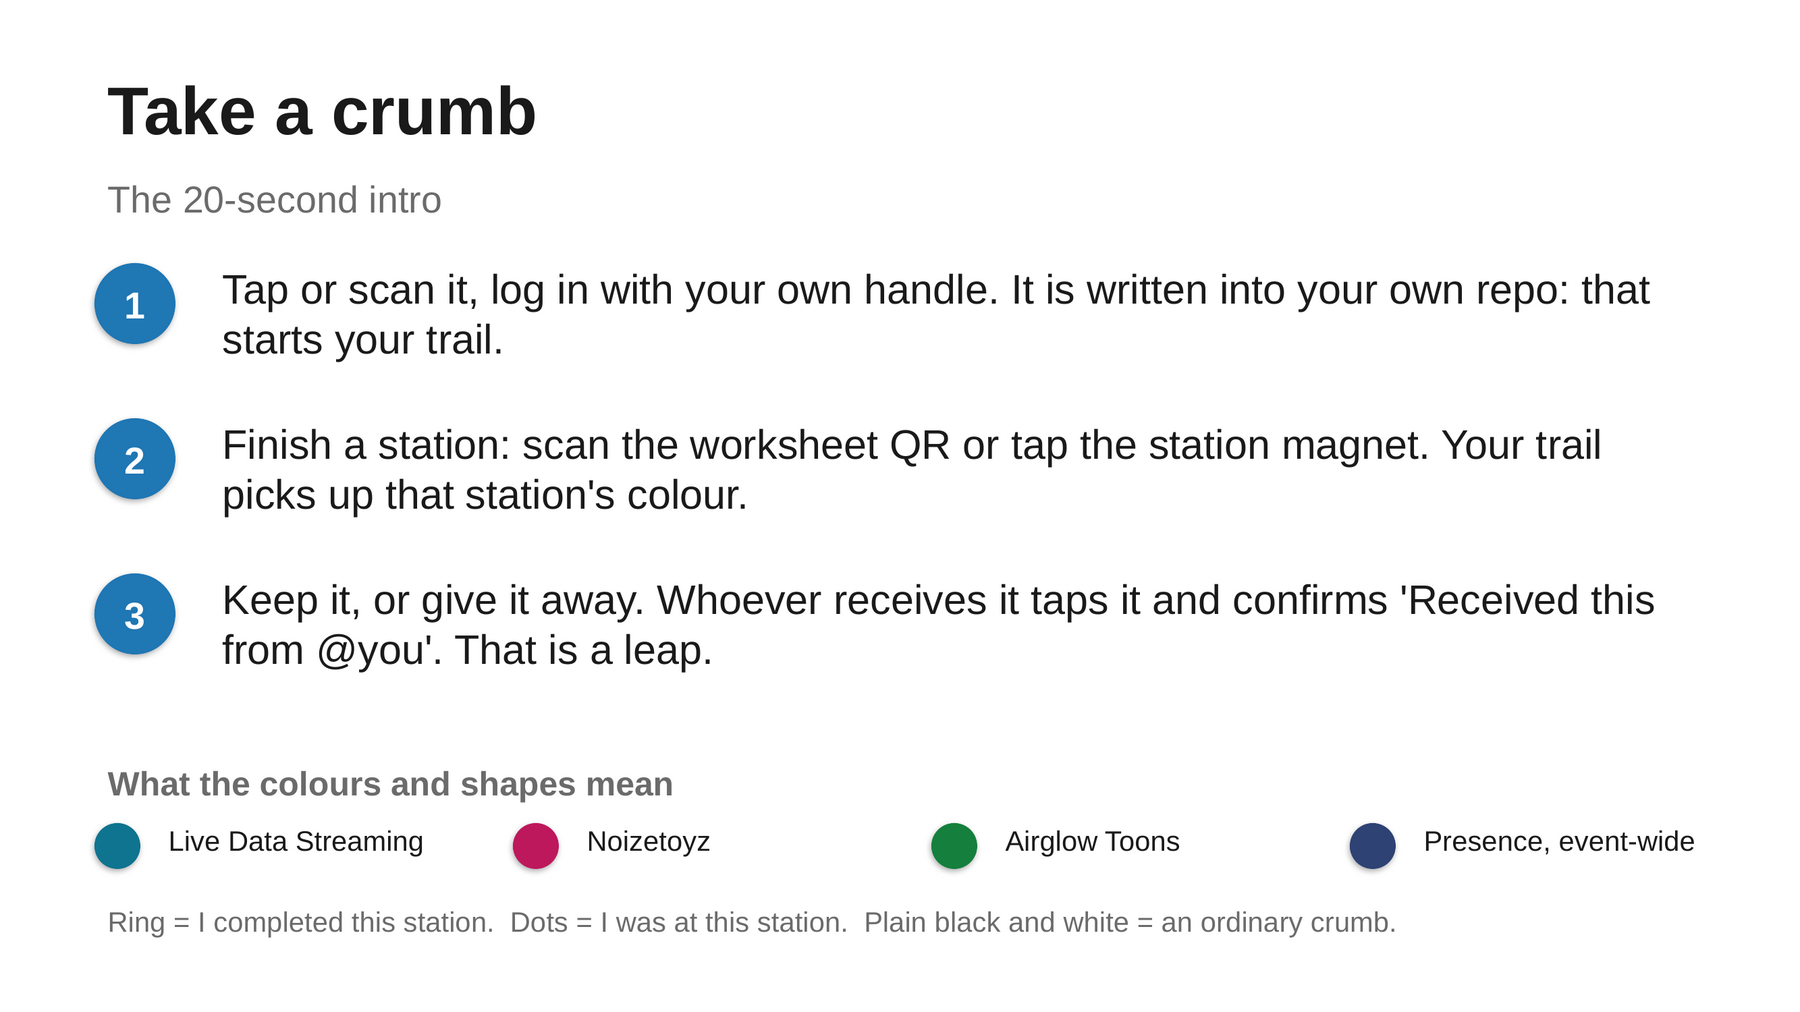
This is the backup slide I keep for questions: the 20-second version, and what the colours and shapes mean.
Simulated graph events (using cadCAD)
The graph I show on a backup slide is constructed, a proposal, not a finding. One run of a model is not an experiment, and the closeness and betweenness numbers on a hand-made graph mean nothing on their own. Whether the claim-based version supports human judgement better than the wallet-based one is a bet, and I will say so in the room.

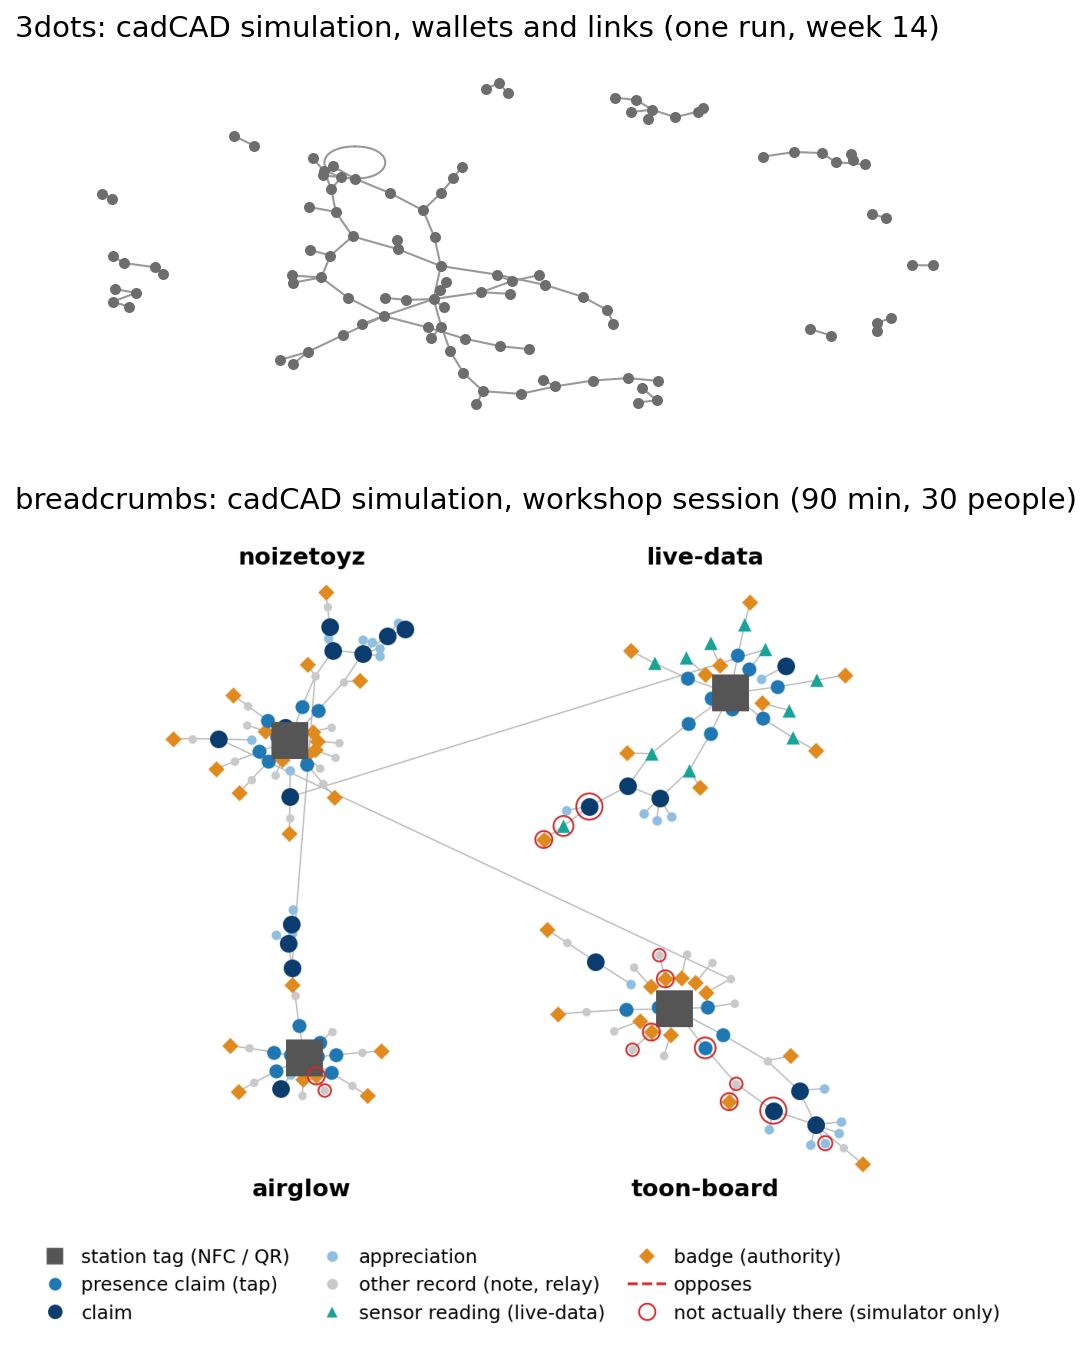
Top: a cadCAD simulation parameterised on the 3dots funding data, one run, week 14. Bottom: a 90-minute workshop session in the breadcrumbs model with 30 people, where every probability is assumed and nothing is calibrated. The red circles mark records that exist only because the simulator made them up, with nothing physically there. Both are one run. Neither is a finding.
The line I will end on
Don't trust the person. Don't trust the number. Read the trail, and judge for yourself.
If you are in Leiden, find the magnets on the station tables, take a keyring, and tell me what broke.

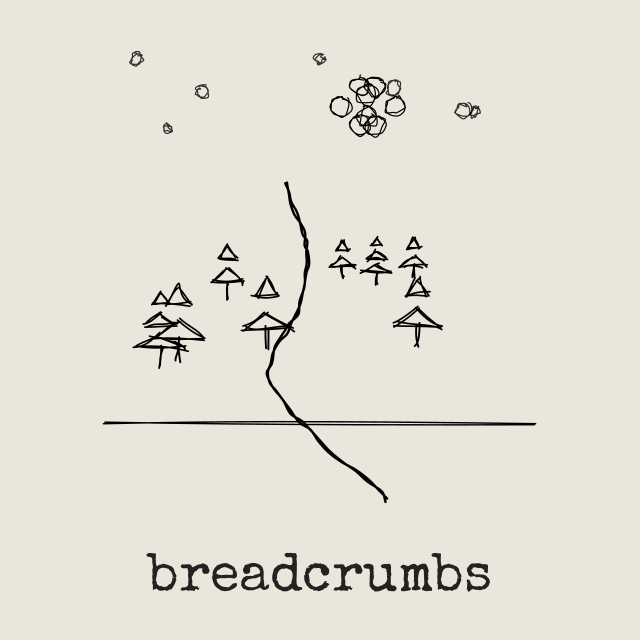
The drawing is generated by the same code that draws every crumb on a trail.